
When I tell people about my field of research, I often get to hear interesting anecdotes about dear friends and family members who age more successful than others. I also encounter statements about large differences between people in almost all scientific literature and talks about aging. To support the statements, I often get to see graphs such as the one below.

The figure depicts memory performance (data invented by me for illustration purposes) of hundred people who have taken a memory test at an age 65 years and then again at an age of 70 years. For example, people may have been asked to recall as many words as possible out of a list of words that previously have been presented on a computer screen. The lines connect the two scores of the same individual. What seems apparent from the figure is that there are large differences in performance between people. Most importantly, the figure shows that some decline more in memory performance than others (i.e., the lines are not parallel). There are even a few people that show stable or even improving performance over time, and thus deviate noticeably from the average decline in memory performance that is substantial, also in the absence of disease, in older age (Rönnlund et al., 2005; Schaie, 1994). A graph looking like this would be typical for the graphs used to support the claim that some age more succesfully than others.
At face value, such graphs are indeed very convincingly supporting the presence of large individual differences in aging. But people, surprisingly often also those trained in statistics and psychometrics, tend to forget the trivial fact that we are bad at measuring things in the behavioral sciences. That is, there is a lot of random errors in our measurements: If people take the same test twice in row on the same day, they tend to get somewhat different scores on the two tests. The phenomenon is like when the weight on your bathroom scale is slightly different if you stand on it a second time just after the first time. It is just that our tests of memory are much worse instruments than the bathroom scale.
In addition to measurement error, there is also true variability in performance from moment-to-moment and day-to-day (Schmiedek et al., 2013). This variability may come from for example motivation, mood, and amount of sleep, and is also affecting the measurement of differences in change over longer periods of time. You might again think on your bathroom scale: Whether you just drank a bottle of water or not will affect the weight in a way that is not necessarily interesting for measuring your long-term changes in weight.
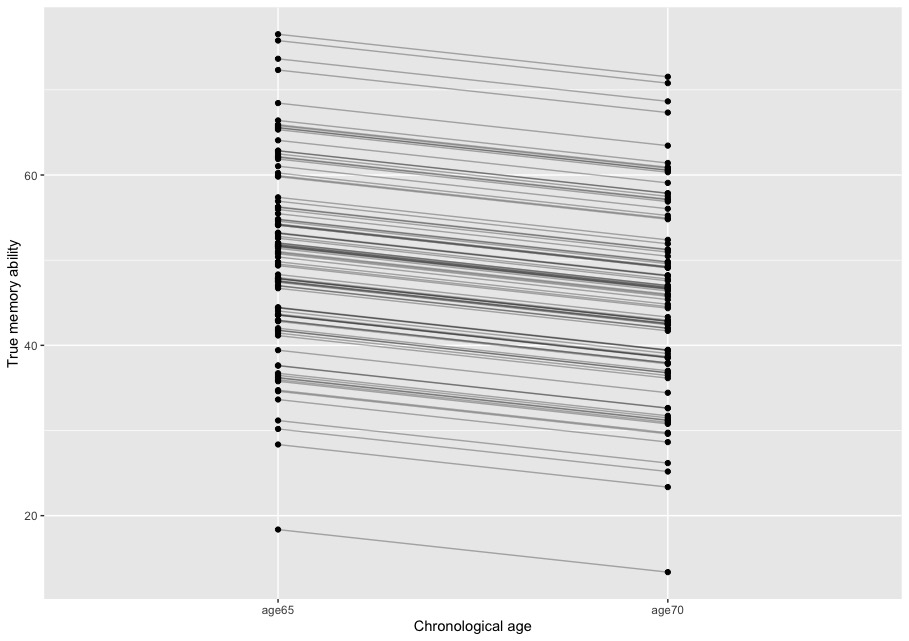
The impact of the fluctuations that stem from measurement error and short-term variability is often underestimated by both laypersons and scientists in the behavioral sciences. In fact, I produced the figure above by assuming no differences between people in their true decline in memory ability from age 65 to 70 years (all were assumed to decline with five points) and then adding a bit of random error (less than what is present for most tests of memory). That is, all the differences between people that we thought were interesting in the figure above were in fact uninteresting random errors in measurement. The true underlying memory ability that I assumed, after removing the measurement error, is depicted in the figure below. We can see that people were assumed to age in an identical way – it was just the measurement error that made it look like they did not.
The above example is just illustrating that we should not mistake measurement error for true differences between people. For those versed in statistics it is a trivial point – but a point that is all too often forgotten about by researchers.
How about it then? Do some people age more succesfully than others? The rather surprising lesson from many years of research that have taken measurement error into account (with statistical techniques) is in fact that differences between people in intellectual abilities are remarkable stable across the entire adult lifespan (e.g., Rönnlund et al., 2015). During younger and middle adulthood people develop pretty much in parallel. In older age, individual differences in how people change appear (e.g., de Frias et al., 2007). Although much smaller than typically portrayed, such differences in aging may be important, especially if they operate in a consistent way over many years. However, the differences between people that are already there when people enter older age, and start to decline in for example memory performance, are at least as important for differences between people in life quality in older age (Lövdén et al., 2020).
Science has the tough task of identifying the factors that explain the individual differences in aging. This task is especially tough because the individual differences in aging are often small in the typical samples of select individuals that we have in our longitudinal studies. That is, with smaller variance in outcome variables (e.g., cognitive performance) it is more difficult to find associations with predictors. We should also not forget that it is at least as important to study the factors that operate during childhood development and that produce the differences between people that are already there when we are starting to grow old. And, let us never forget about measurement error again.
Appendix: A simple R code to produce the figures
#Load libraries
library(tidyverse)
library(GGally)
#Generating true
age65 <- rnorm(100,50,10)
age70 <- age65-5
data.true <- cbind(age65,age70)
#Plot true score
ggparcoord(data.true,
columns = 1:2,
scale=”globalminmax”,
showPoints = TRUE,
alphaLines = 0.3
) +labs(y= “True memory ability”, x = “Chronological age”)
#Generating error
age65error <-rnorm(100,0,2)
age70error <-rnorm(100,0,2)
#Generating observed scores
age65 <- age65+age65error
age70 <- age70+age70error
data.obs <- cbind(age65,age70)
#Plot observed score
ggparcoord(data.obs,
columns = 1:2,
scale=”globalminmax”,
showPoints = TRUE,
alphaLines = 0.3
) +labs(y= “Observed memory performance”, x = “Chronological age”)
